Quarterly Review
4Q2023 Investor Letter

 Detailed Review
The Waffle
Abstract(ions)
- A Federal Reserve “waffle” of extraordinary proportions is now underway.
- The Pavlovian market response to dramatically lower interest rate expectations highlights associated risk in broader indices laced with “mega-cap” and other speculative equities.
- Broader investor appreciation of downside risk is near generational lows.
The Accord is “The Standard”
In March of 1951, William McChesney Martin Jr. switched teams. The affable 44-year-old assistant treasury secretary had just helped orchestrate the most seminal and unlikely evolution in the Federal Reserve modus operandi since its founding in 1913. Inflation was reaccelerating yet again as the Korean War intensified, after nearly a decade of rolling waves of inflation surrounding WWII. The Truman Administration to which Martin belonged had relied upon the idea that the Fed would (at Truman’s direction) reduce borrowing costs (even after the War) by pinning interest rates at low levels. It took nearly a decade of inflationary pain to highlight the economic absurdity of the idea that the U.S. government could run large deficits, issue debt to finance the deficits, and then purchase the debt itself to restrict the interest rates of that debt. The awakening thereto gave birth to the Treasury-Fed Accord of 1951 architected by Martin et. al., which established clear independence for the Fed to set appropriate interest rates regardless of political or other outside interests.

The Fed’s record of adherence to Martin’s sound-money true north has been, shall we say, incomplete since Martin retired in 1971 after nearly two decades as Fed chair. While the Accord set a standard that should have been canonical, the greatest standards naturally invite deviation. Why? Because they are difficult. Like a child testing the heat of a stove repeatedly for a few seconds more each time, the Fed has (with increasing audacity) pretended to adhere to Martin’s standard only to acquiesce to cries for relief from it. The “Fed put” coined under Greenspan once required at least some amount of pain to be exercised. Indeed, the word “put” in this context references a “put option” – a financial instrument that can mitigate losses when the asset underlying the option falls in value. The Fed put refers to rate cuts or other policy easing enacted to support the value of assets (e.g. equities) when prices fall in an uncomfortable fashion. For over two decades, this has been the Fed’s “relief valve.”
From Put to Waffle
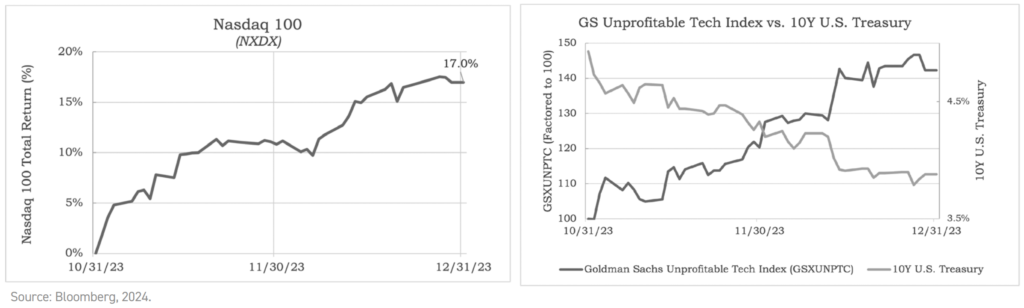
In late 2023, Fed chair Jerome Powell provided an acquiescence worthy of new terminology. In an abrupt about-face, the Fed has now all but explicitly accepted the path toward rate cuts. While much ink is spilled about what the Fed means when its officials say things, it is often more informative to simply look to the market. Following the Fed’s various communications in late 2023, interest rate markets now predict nearly six (!) quarter point rate cuts in 2024 with high probability. Given the many speeches by Powell over the last two years spent railing against the evils of inflation and channeling former Fed chair Paul Volcker with promises of “higher for longer” rates, this is a notable shift. However, with unemployment at 3.7%, the Nasdaq up +56% in 2023, and equities near all-time highs, a description of this shift as a “Fed put” feels like something of a mischaracterization. The term “waffle” seems more apt. The possibilities as to why the Fed wilted this time are numerous, the exploration of which deserves its own essay. What is more important presently is that it has happened, and what (if anything) the discerning, risk-aware investor is to do about it.
Risk: The Market Hardly Remembers Thy Name
Powell’s waffle represents the next and perhaps greatest test of the macroeconomic stove to date. When will the Fed finally be burned? We don’t know; but we can make a few observations related to our favorite topic next to dividends: risk. To say we have seen a dramatic recalibration of Mr. Market’s pricing of that very thing would be, well, an understatement. The interest rate on a 10-year U.S. government note fell by a full percentage point in the two final months of 2023. Broader financing rates and risk assets responded in kind. The 30Y mortgage rate went from over 8% to 6.99% just as reports on the reacceleration in housing demand surfaced (amid still rising prices). The Goldman Sachs Unprofitable Tech index rose +42% in the final two months of 2023 alone, along with huge surges in “meme stocks,” cryptocurrencies, and the like.
From our quiescent Cincinnati perch at Bahl & Gaynor – comfortably removed from Manhattan and Silicon Valley – it is not overly difficult to view this state of affairs with a fair degree of skepticism. We exist, quite simply, to increase certainty and peace of mind for our clients. This is derived in large part through consistency. Consistency of cash income growth, and consistency of capital with a “first principles” focus on downside risk. To do this, we focus exponentially more on the ways we can protect capital when the inevitable downdrafts in markets occur than on chasing the “last ounce” of upside when animal spirits are at maximum. Through a full cycle of returns (i.e., “the long term”), we feel proud to have seen this work quite well: we’ve generated annualized alpha of +1.43% (gross) and +1.05% (net) in our Income Growth strategy and +2.75% (gross) and +2.33% (net) in our Small/Mid Cap Income Growth (smig®) strategy since inception.(3) In our humble opinion, this is a nuanced investment approach that must be built purposefully and employed ubiquitously to have any hope of success. When the market’s tide inevitably ebbs for any number of reasons, it is too late.
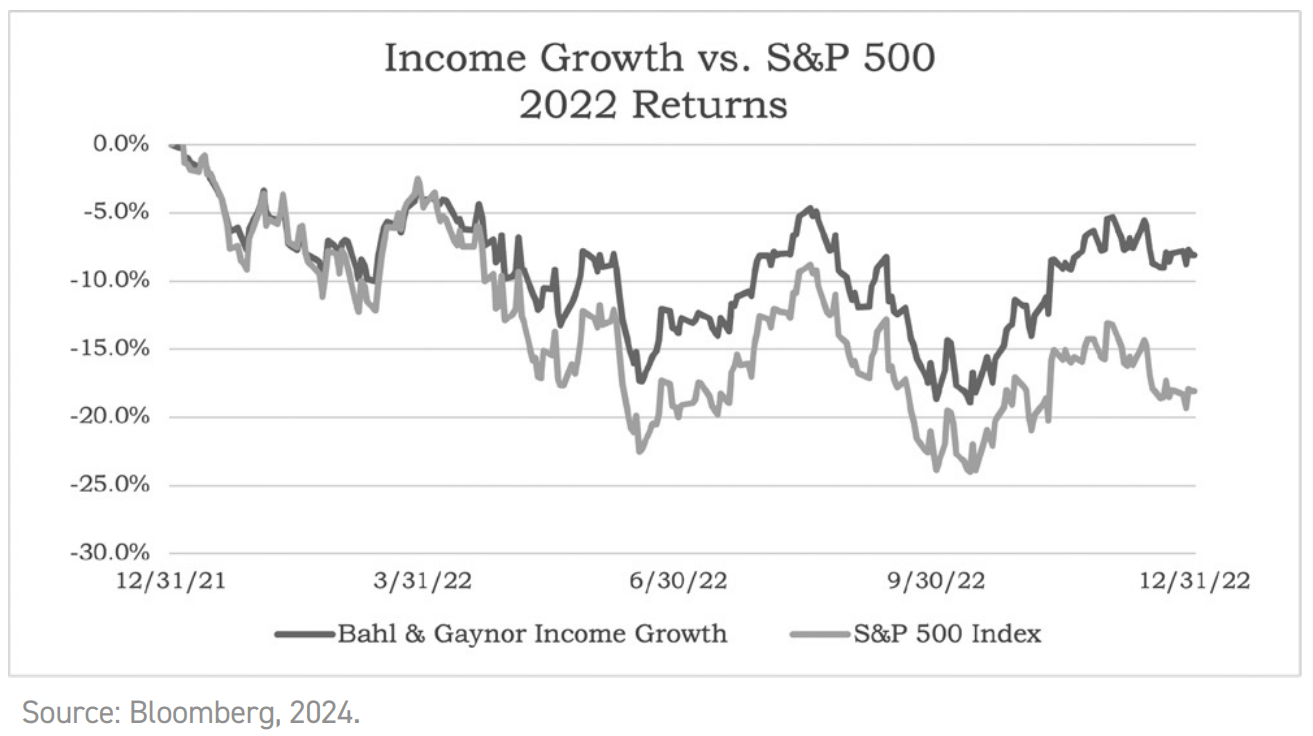
Bahl & Gaynor mostly trailed the market’s (historic) speculative total return resurgence in 2023, a result that isn’t overly surprising given the tenor of the levitation vis-à-vis our philosophy. That experience exists in stark contrast to the risk-resurgence served up in 2022. In that year, Bahl & Gaynor’s Income Growth strategy was down just 8.1% (gross) or 8.4% (net) versus the 18.1% decline of the S&P 500.(4) While we can never know how our results will unfold in the future, this (along with compounding income growth) is what we design for. Perhaps “secular stagnation,” an aging population, the “global savings glut”, or any number of other potential developments will allow the Fed to continue “testing the stove” with its relentless pursuit of lower rates. This is what we reckon it may take for market indices laden with “mega cap” and speculative issues to continue to repeat the results of 2023. Alternatively, perhaps economic reality will finally take hold and the Fed’s hand will finally be burned with more persistent inflationary pressure, now occurring alongside ballooning fiscal imbalances and geopolitical unrest. Elevated prices of assets that consume rather than create capital can pose (more immediate) risk if the condition that leads to the elevation turns out to be unsustainable. It is precisely these assets (and market indices driven by them) that are likely to be most at risk if the second genre of outcomes unfolds.
As always, I encourage you to reach out with questions, feedback, and comments. Thank you for the trust you place in us and your partnership with Bahl & Gaynor.
Sincerely,

Robert S. Groenke
Chief Executive Officer
Disclosures
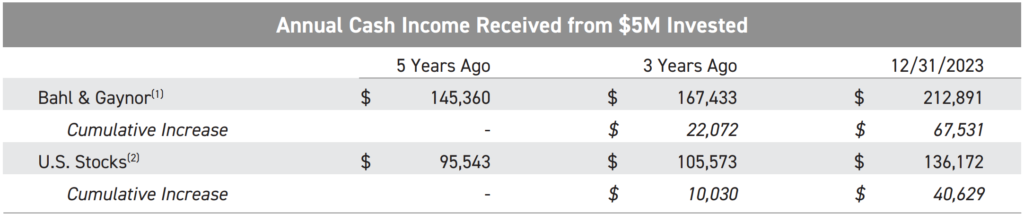
(1) Bahl & Gaynor annual cash income received is calculated on a gross of fee basis and does not incorporate the impact of advisory and other fees which will be experienced by investors. The Bahl & Gaynor value is calculated each quarter, beginning 12/31/2017 with hypothetical $5,000,000 starting capital split 50%/50% between the Bahl & Gaynor Income Growth SMA strategy (Income Growth) and the Bahl & Gaynor smig® SMA strategy (smig). Quarterly income earned is calculated using each SMA strategy’s historical model income, adjusted by a multiplier factor to reflect the starting capital. Income includes the reinvestment of income. Four quarters of income are summed to calculate annual income received in each period shown. The initial 50%/50% allocation occurs at the beginning of the five-year period and is not rebalanced thereafter.
(2)US Stocks annual cash income received is calculated each quarter, beginning 12/31/2017, with a hypothetical $5,000,000 investment in the Vanguard® Total Stock Market Index Fund ETF (Ticker: VTI) which was chosen to represent an investable market cap-weighted index that invests across large-, mid-, and small-cap stocks and distributes income in the form of quarterly dividends. Quarterly income is calculated by multiplying the implied number of shares purchased with $5,000,000 at initial investment by the quarterly dividend rate and assuming income reinvestment to increase the number of implied shares each subsequent quarter.
(3)Source: Informa – PSN. As of 12/31/2023. Alpha is a measure of risk-adjusted return expected from a portfolio above the benchmark return at any point in time. Income Growth strategy figures are derived from the Income Growth institutional composite. The Income Growth strategy was incepted 12/31/2005 and is benchmarked to the S&P 500. Smig® strategy figures are derived from the smig® institutional composite. The smig® strategy was incepted 3/31/2013 and is benchmarked to the Russell 2500. Past performance does not guarantee future results.
(4)Past performance does not guarantee future results. Income Growth performance is derived from the institutional composite. Other methods may produce different results and the results for individual accounts and for different periods may vary depending on market conditions and the composition of the account. Care should be used when comparing these results to those published by other investment advisers, other investment vehicles and unmanaged indices due to possible differences in calculation methods.
First page illustration sourced from: https://ids.si.edu/ids/dynamic?id=https://npg.si.edu/media/9401048B.jpg&container.fullpage&iframe=true&width=85%25&height=85%25
This report contains information sourced from third parties. Bahl & Gaynor does not represent the information is accurate or complete and it should not be relied on as such. Bahl & Gaynor assumes no liability for the interpretation or use of this report. Past performance does not guarantee future results. Historical performance results for investment indices and/or categories have been provided for general comparison purposes only, and generally do not reflect the deduction of transaction and/or custodial fees, the deduction of an investment management fee, nor the impact of taxes, the incurrence of which would have the effect of decreasing historical performance results. It should not be assumed that account holdings do or will correspond directly to any comparative indices. The index and other amounts shown above do not relate to Bahl & Gaynor strategies and are for illustrative purposes only.
The “S&P 500” is a product of S&P Dow Jones Indices LLC (“SPDJI”), and has been licensed for use by Bahl & Gaynor. Standard & Poor’s® and S&P® are registered trademarks of Standard & Poor’s Financial Services LLC (“S&P”); Dow Jones® is a registered trademark of Dow Jones Trademark Holdings LLC (“Dow Jones”); and these trademarks have been licensed for use by SPDJI and sublicensed for certain purposes by Bahl & Gaynor. Large Cap Quality Growth is not sponsored, endorsed, sold or promoted by SPDJI, Dow Jones, S&P, their respective affiliates and none of such parties make any representation regarding the advisability of investing in such product nor do they have any liability for any errors, omissions, or interruptions of the S&P 500.
Indices are unmanaged, hypothetical portfolios of securities that are often used as a benchmark in evaluating the relative performance of a particular investment. An index should only be compared with a mandate that has a similar investment objective. An index is not available for direct investment, and does not reflect any of the costs associated with buying and selling individual securities or management fees.
Investment advisory services provided through Bahl & Gaynor Investment Counsel (“B&G”), a federally registered investment adviser under the Investment Advisers Act of 1940. Registration does not imply Information or a certain level of skill or training. More information about B&G can be found by visiting www.adviserinfo.sec.gov and searching by the adviser’s name. This is prepared for informational purposes only and may not be applicable to your particular situation or need(s). It does not address specific investment objectives. Information in these materials are from sources B&G deems reliable, however we do not attest to their accuracy. Past performance is not indicative of future results. Indices and benchmarks are unmanaged and cannot be invested in directly. Returns represent past performance, are not a guarantee of future performance, and are not indicative of any specific investment. Index return information is provided by vendors and although deemed reliable, is not guaranteed by B&G. No fiduciary relationship exists because of this commentary. If you have any questions regarding the indices or investments referenced in this presentation, contact your B&G investment professional.