Thought Leadership
Capping Risk: The Value of Dividend Growth in a Cap-dominated Landscape


Executive Summary
- Market narrowness in 2023 is well understood, but history suggests narrowness may be at an extreme.
- Reversion of cap-weighted index returns may be a risk for investors, but even removing cap-weighted concentrations (using an equal-weighted index) does not significantly alter the overall index risk profile.
- Bahl & Gaynor’s dividend growth equity approach has historically delivered a risk profile akin to an 80% equity balanced portfolio, which is compelling especially when paired with the return potential of the strategy’s 100% equity allocation.
- Advisor conversations with clients should consider the benefit of risk reduction and inflation-adjusted portfolio income growth targeted by Bahl & Gaynor’s philosophy amid a historically unbalanced market backdrop.
Recent Equity Market Narrowness
It is well understood that recent market performance has been dominated by the largest constituents of many equity indices. For the year-to-date period through 11/30/2023, the top 10 S&P 500 index constituents represented 72.6%¹ of index total return, nearly 3x the average observed by Goldman Sachs since 1980².
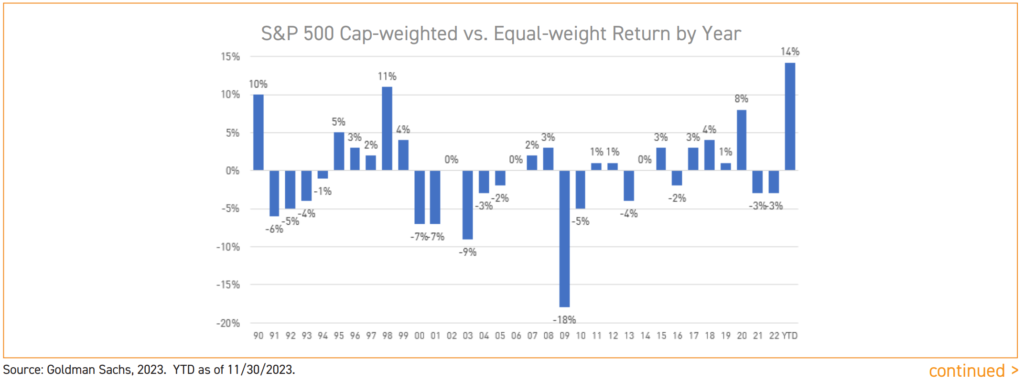
One way of gauging the influence of large companies on cap-weighted index returns is the spread between the cap-weighted and equal-weighted return of the same index pictured below since 1990.
Important Observations from Chart
- The year-to-date return experience of the cap-weighted index is an outlier to the upside, registering at a series-high +14% spread.
- Prior years of similarly outsized positive spreads were 2019 (pre-pandemic), 1998/99 (pre-Tech bubble burst), and 1990 (savings & loan crisis) – all years involving or presaging calamitous market events.
- The series appears to be mean reverting, with an average spread of 0% across all years, meaning positive and negative divergences eventually converge.
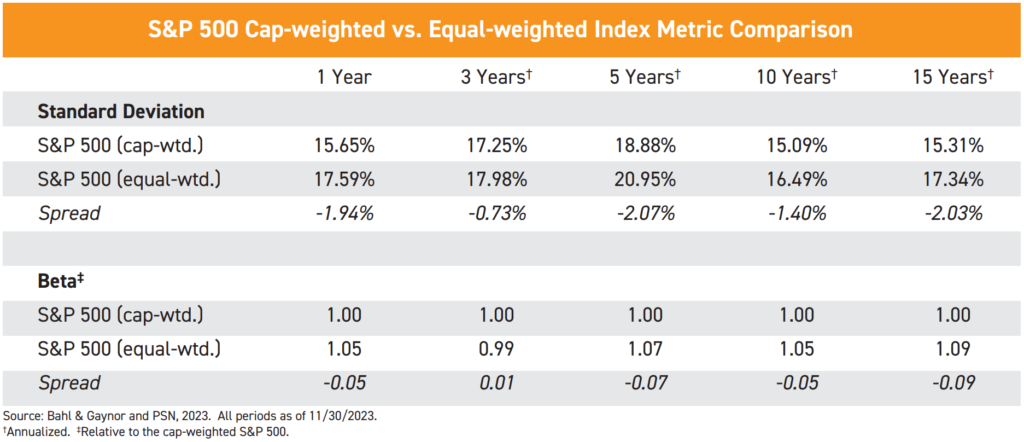
Taken together, this evidence suggests there is risk to be managed in the current market backdrop, but even removing the impact of size on a cap-weighted index does not meaningfully alter risk exposure – in fact, it often increases risk metrics.
Positioning Thoughts with Truly Active Management
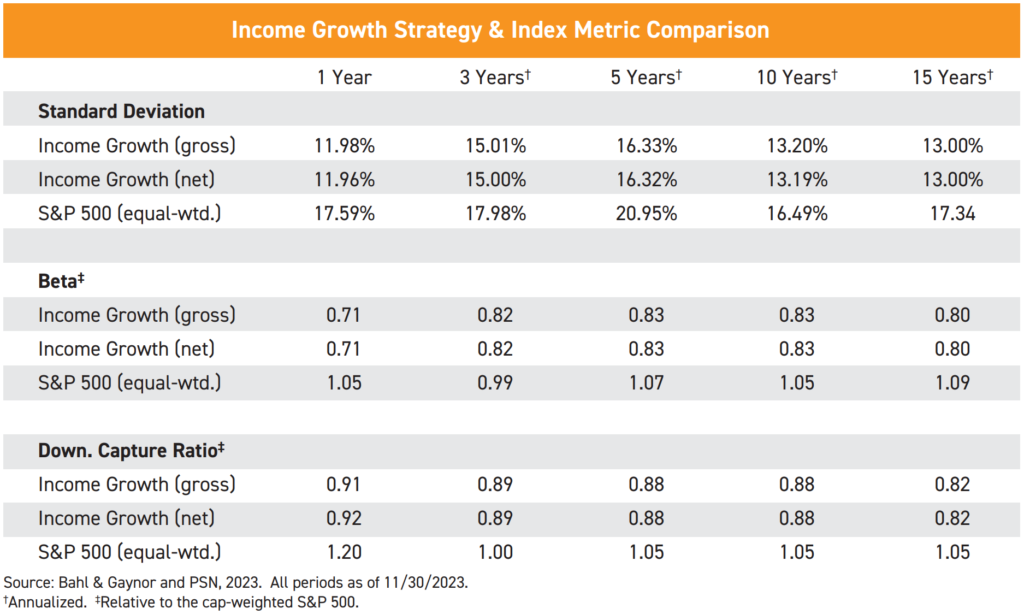
Bahl & Gaynor’s dividend growth philosophy emphasizes not only difference from an index, but also places great emphasis on risk management through fundamental analysis and individual company selection. This analysis and selection are targeted at a company’s ability to compound capital and share this compounding with investors via a growing dividend. Companies demonstrating an ability to consistently compound shareholder capital also tend to possess a materially lower risk profile than the overall market. Bahl & Gaynor attempts to capture these benefits in the firm’s Income Growth strategy.
As outlined below, our fundamental analysis and selection framework have historically produced a lower risk profile versus an equal-weighted index – a useful outcome for risk management purposes.
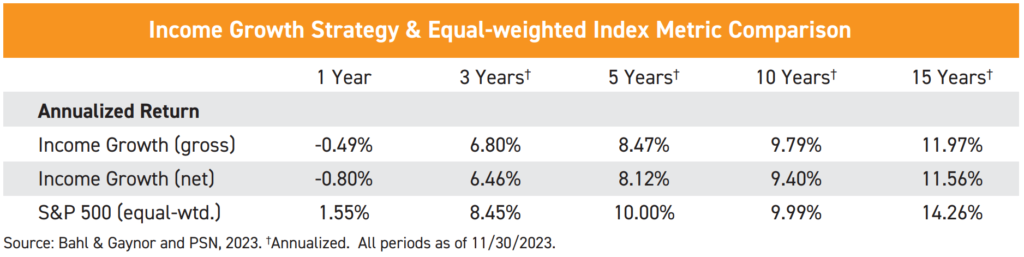
Return, of course, is an important consideration for any risk asset allocation, and the Income Growth strategy has historically delivered a return profile within ±300 basis points of the equal-weighted S&P 500, noted below, which is meaningful considering the historically lower risk profile of the Income Growth strategy.
Timeliness of Risk-aware Strategy Allocations
With the need for risk management being identified, a discussion of timing is an important accompanying consideration for advisors and their clients.
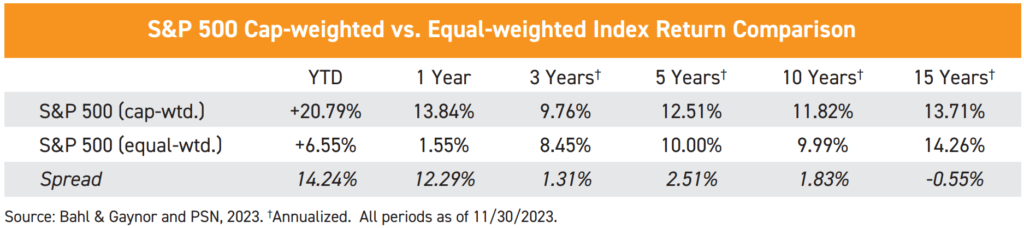
Related to the cap versus equal-weighted chart presented at the beginning of this discussion, it is important to keep in mind where trailing cap-weighted equity returns reside relative to their long-run averages.
Ken French data going back to 1927 observes Total Equity Market annualized return to be +9.8%³. Cap-weighted S&P 500 returns are significantly positive and near or above this average for all timeframes listed below with divergence over this long-run average and the equal-weighted index building incredibly over the last three years.
It is commonly known that risk asset returns tend to be mean reverting, suggesting future headwinds for cap-weighted index returns.
Bahl & Gaynor believes consideration of our approach as a diversifying and risk-aware offset to the current market fact pattern is a valuable exercise as advisors and clients look to position their portfolios into 2024 and beyond.
Bottom Line Conclusions
- Equity exposure, particularly cap-weighted exposure, may present underappreciated risks to investors given the historically high trailing returns associated with these components of the equity market.
- Adjusting equity positioning from cap-weighted to equal-weighted exposure may not provide an adequately differentiated risk profile to justify shifting allocation.
- Bahl & Gaynor’s Income Growth strategy may present an opportunity to meaningfully shift an investor’s risk profile, particularly in the current environment dominated by cap-weighted equities. This can be done with the additional benefit of both an above-average dividend yield providing growing portfolio income as well as a historical risk profile akin to an 80% equity balanced portfolio.
¹Source: Bahl & Gaynor, PSN and Factset as of 11/30/2023.
²Source: Goldman Sachs as of 6/30/2023.
³Data from 6/30/1927 – 12/31/2022. Source: Ken French’s Website – http://mba.tuck.dartmouth.edu/pages/faculty/ken.french/index.html; Total Equity Market Index is representative of US public equity securities listed on the NYSE, AMEX or NASDAQ exchange; Monthly returns are calculated on a value-weighted basis. Information sourced from third party. Bahl & Gaynor does not represent the information is accurate or complete and it should not be relied on as such. Bahl & Gaynor assumes no liability for the interpretation or use of this report. For illustration purposes only. Past performance does not guarantee future results. All results are hypothetical, and the results are not based on the performance of an actual portfolio and the interpretation of the results should take into consideration of the limitation inherent in the results of the model. The results exclude any advisory fees, trading cost or other fees or charges. The reinvestment of dividends, interest, capital gains and withholding taxes are all built into the hypothetical analysis. Hypothetical returns may be dependent on the market and economic conditions that existed during the period. Future market or economic conditions can adversely affect the performance of the hypothetical analysis. The index and other amounts shown above do not relate to the Bahl & Gaynor Income Growth strategy and are for illustrative purposes only.
Disclosures
As of Date: 11/30/2023, unless otherwise noted.
This Report has been prepared for Financial Professionals whose clients are invested in strategies managed by Bahl & Gaynor. Not for use with the General Public.
Performance is preliminary, subject to change.
The primary focus for the Income Growth Strategy is generating current income higher than that of the S&P 500 that will grow over time. Protection in falling markets is a secondary goal, with long-term capital appreciation as a tertiary goal. The Strategy is designed for long-term investors who are willing to accept short-term market price fluctuations. Principal risks of investing in this strategy include stock market risk, management risk, recent market events risk, and large cap company risk. All equity investments inherently have aspects of risk associated with them; past performance is not indicative of future results. An issuer of a security may be unwilling or unable to pay income on a security. Common stocks do not assure dividend payments and are paid only when declared by an issuer’s board of directors. The amount of any dividend may vary over time. The above is intended only to illustrate how Income Growth Strategy has behaved in relation to the S&P 500 Index on down days and makes no representation about investment performance. Indices are unmanaged, hypothetical portfolios of securities that are often used as a benchmark in evaluating the relative performance of a particular investment. An index should only be compared with a mandate that has a similar investment objective. An index is not available for direct investment and does not reflect any of the costs associated with buying and selling individual securities or management fees.
Investment advisory services offered through Bahl & Gaynor (“B&G”), a federally registered investment adviser under the Investment Advisers Act of 1940. Registration does not imply Information or a certain level of skill or training. More information about B&G can be found by visiting www.adviserinfo.sec.gov and searching by the adviser’s name. This is prepared for informational purposes only and may not be applicable to your particular situation or need(s).
Some figures are sourced using third-party data. Bahl & Gaynor does not represent the information is accurate or complete and it should not be relied on as such. Bahl & Gaynor assumes no liability for the interpretation or use of this report. For Illustration purposes only. Past performance does not guarantee future results. The index and other amounts shown above do not relate to the Bahl & Gaynor strategies and are for illustrative purposes only.
The “S&P 500” is a product of S&P Dow Jones Indices LLC (“SPDJI”) and has been licensed for use by Bahl & Gaynor. Standard & Poor’s® and S&P® are registered trademarks of Standard & Poor’s Financial Services LLC (“S&P”); Dow Jones® is a registered trademark of Dow Jones Trademark Holdings LLC (“Dow Jones”); and these trademarks have been licensed for use by SPDJI and sublicensed for certain purposes by Bahl & Gaynor. Income Growth and smig® are not sponsored, endorsed, sold or promoted by SPDJI, Dow Jones, S&P, their respective affiliates and none of such parties make any representation regarding the advisability of investing in such product nor do they have any liability for any errors, omissions, or interruptions of the S&P 500.
Indices are unmanaged, hypothetical portfolios of securities that are often used as a benchmark in evaluating the relative performance of a particular investment. An index should only be compared with a mandate that has a similar investment objective. An index is not available for direct investment and does not reflect any of the costs associated with buying and selling individual securities or management fees.