Thought Leadership
Big Reasons to Think Small: The Merits of a Small/Mid-Cap Dividend Growth Allocation


Executive Summary
- In conversations with advisors and their clients, small/mid-cap equity exposure consistently presents as an under-allocated portfolio opportunity.
- Several common reasons presented for under-ownership, we observe, are more relevant to broad index-level characteristics rather than characteristics obtainable through selective active management exposure.
- Ken French data going back to 1927 highlights the historically higher return potential of Small Stocks versus the Total Equity Market, but the potential reward and risk profile of Small/Mid Dividend Stocks deserves additional attention.
- Recent underperformance of the small/mid-cap equity space vis-à-vis its large cap counterpart may have expanded the future opportunity and timeliness of a small/mid-cap equity allocation today.
- Bahl & Gaynor’s smig® Small/Mid-Cap Income Growth strategy could provide thoughtful exposure to the small/mid-cap equity space by avoiding the unique challenges inherent in broad indices and shifting focus to the potential benefits of dividend growth and downside protection.
Small/Mid-Cap Equity Exposure Misconceptions
The small/mid-cap equity space is unique in the sense that it is an often-overlooked equity market segment. In a world of “efficient” markets, the presence of overlooked risk assets should capture the attention of thoughtful advisors and their clients.
Perceived challenges often expressed when considering an allocation to the small/mid-cap space include:
- Supposed excessive volatility and cyclicality of the market cap range.
- Lack of catalyst for reversal of recent underperformance.
- Aversion to allocating away from the decade-long winner: large cap equity.
These objections should be viewed as opportunities:
- Volatility in the small/mid-cap space may exist at the index level, but active management can target lower-volatility constituents hidden within broader indexes.
- Current market conditions may have created extremes that often catalyze mean reversion in favor of small/mid-cap outperformance.
- Many of the favorable qualities of large cap exposure can be replicated in a thoughtful, active small/mid-cap equity approach.
Bahl & Gaynor is excited to share its view of opportunities present in the small/mid-cap equity space, and the potential solution our firm brings: the smig® Small/Mid-Cap Income Growth strategy.
Characteristics of Small/Mid-Cap Exposure
Small/mid-cap equity exposure can be more volatile than large-cap equity exposure. Ken French data going back to 1927 highlights (below) that the standard deviation and beta of Small Stocks is materially higher than the Total Equity Market, a large cap-biased proxy.
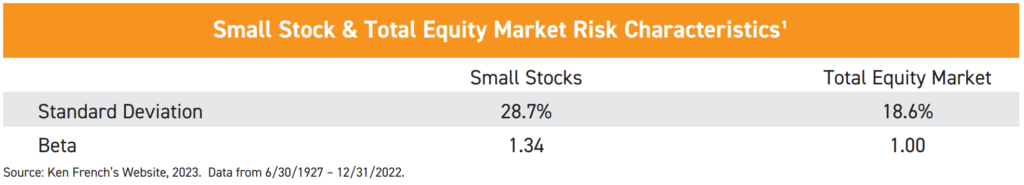
The reasons for this are myriad, but investors allocated to the space are often attracted to it by the commensurately higher expected returns associated with bearing more risk. Indeed, smaller, less mature companies may have longer runways for growth, and this could support a higher return profile than larger, more mature counterparts. However, an investor need not resign their ownership to all small stocks – this can result in higher risk exposure as indicated by the lower Sharpe ratio (reward vs. risk) of Small Stocks in the exhibit below. A further dissection of French’s data targeting the middle 40% of dividend-yielding companies and bottom 50% of market capitalizations in the Total Equity Market produces fascinating results expressed in the following table.
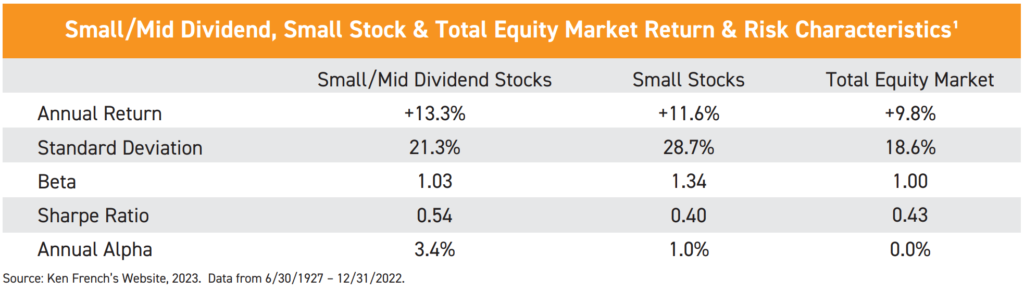
Several observations may be drawn from the results above:
- Small/Mid Dividend Stock returns have historically outpaced Small Stocks and the Total Equity Market.
- The standard deviation (volatility) profile of Small/Mid Dividend Stocks is historically between that of Small Stocks and the Total Equity Market.
- Small/Mid Dividend Stocks produce a lower beta, higher Sharpe ratio, and higher alpha than Small Stocks and the Total Equity Market, suggesting the cohort construction of Small/Mid Dividend Stocks constrained volatility and enhanced return profile.
Bahl & Gaynor’s track record and experience as a dividend growth manager attempts to capture the benefits of Small/Mid Dividend Stocks in our smig® Small/Mid-Cap Income Growth strategy. The strategy seeks to provide above-average current income and resilient portfolio income growth, downside protection, and competitive through-cycle risk adjusted returns vis-à-vis the small/mid-cap equity universe.
The Opportunity in Recent Small/Mid-Cap Performance
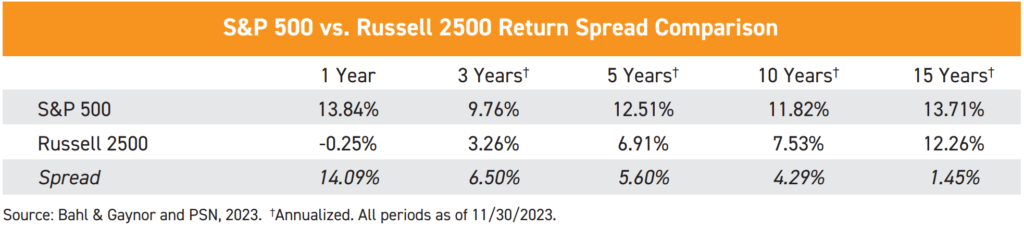
While Small Stocks have historically outperformed the large cap-biased Total Equity Market, the small/mid-cap Russell 2500 index has lagged the large-cap S&P 500 index over the last 15 years.
There are several plausible reasons for this situation, many of which could be the scope of another paper, but secular trends are frequently caused by secular disruptions and continued evolution of those disruptions can alter secular trends. In this case, the evolving disruption may involve global central banks ending over a decade of intervention via quantitative easing in a campaign to rein in global inflation impulses by tightening financial conditions. Quantitative easing, in Bahl & Gaynor’s opinion, has inflated the price of most risk assets. A reversal of easing to tightening may result in more varied future performance across different categories of risk assets. The small/mid-cap portion of the equity risk assets harbors a notable delineation within its constituency: 38%² of Russell 2500 constituents are unprofitable.
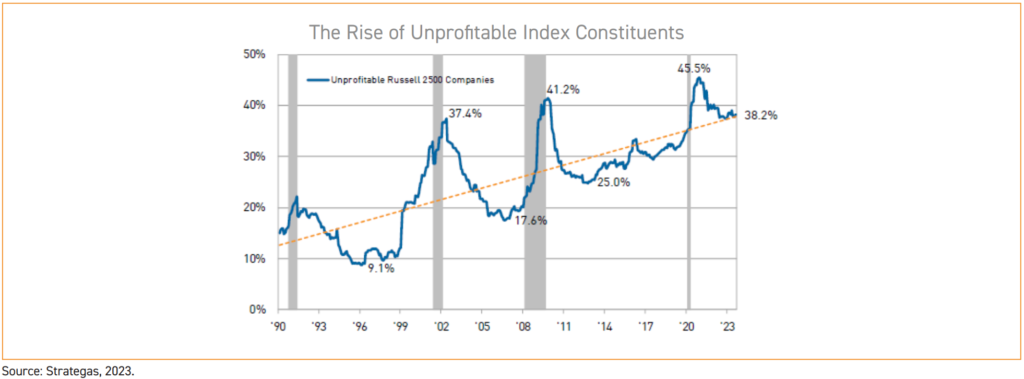
Unprofitable companies are generally reliant on access to external sources of capital. If this capital remains expensive and scarce, it may disproportionately and negatively affect unprofitable companies. The dividend-paying and dividend-growing companies Bahl & Gaynor targets for investment produce more capital than they consume (indeed, a dividend is a means of returning excess capital to shareholders).
Profitable companies may be able to remain nimble in an era of tighter financial conditions, and to the extent this cohort has faced the same performance headwind as the broad small/mid-cap index, there could be an opportunity for this group to differentiate itself in terms of risk-adjusted performance going forward.
Potential Benefits of Bahl & Gaynor’s smig® Small/Mid-Cap Income Growth Approach
Bahl & Gaynor believes it has developed a solution to provide thoughtful exposure to a desirable subset of the small/mid-cap equity market:
- By focusing on investing in companies capable of delivering a growing dividend stream derived from sustainable earnings growth, the strategy attempts to mitigate exposure to the preponderance of unprofitable small/mid-cap companies, which we believe may be valuable in periods of tighter financial conditions.
- In doing so, the smig® Small/Mid-Cap Income Growth strategy provides exposure to the small/mid-cap equity space through a framework that attempts to minimize volatility; in fact, the strategy has delivered a since-inception³ standard deviation of return of 15.38% (net of fees⁴) closer to that of the large-cap S&P 500 (14.81%⁴) than the small/mid-cap Russell 2500 (18.31%⁴).
- These strategy features, paired with the potential mean reversion impulse of small/mid-cap equities over large-cap equities represents a thoughtful discussion item for advisors to review with clients, and a potential positioning opportunity for client portfolios.
Bottom Line Conclusions
- Several common objections are cited as a reason to avoid small/mid-cap equity exposure, but these objections tend to be more relevant to broad index-level exposure, not selective and actively managed exposure.
- Ken French data going back to 1927 highlights the historically higher return potential of Small Stocks versus the Total Equity Market, but the potential reward and risk profile of Small/Mid Dividend Stocks deserves additional attention.
- Building underperformance of the small/mid-cap equity space vis-à-vis the large cap universe may imply a stronger and/or longer reversion impulse in the future.
- Tighter global financial conditions may present the circumstances for profitable small/mid-cap companies to differentiate themselves from broad small/mid-cap indices, which are replete with unprofitable company exposures.
- Bahl & Gaynor’s smig® Small/Mid-Cap Income Growth could provide thoughtful exposure to the small/mid-cap equity space, controlling for the unique challenges of broad index exposure, and shifting focus of this exposure to the potential benefits of dividend growth and downside protection.
¹Data from 6/30/1927 – 12/31/2022. Source: Ken French’s Website – http://mba.tuck.dartmouth.edu/pages/faculty/ken.french/index.html; Total Equity Market Index is representative of US public equity securities listed on the NYSE, AMEX or NASDAQ exchange; Small Stocks is representative of US public equity securities with a market capitalization in the bottom 30% (excluding REITs) of the NYSE and includes all NYSE, AMEX, and NASDAQ stock that fit the market cap criteria; Small Cap Mid-Dividend Yield is representative of companies with a dividend yield in the middle 40% of dividend payers with a market capitalization in the bottom 50% of the NYSE (excluding REITs) and includes all NYSE, AMEX, and NASDAQ stocks that meet these criterion, all three indexes are reconstituted annually in June. Monthly returns are calculated on a value-weighted basis. Information sourced from third party. Bahl & Gaynor does not represent the information is accurate or complete and it should not be relied on as such. Bahl & Gaynor assumes no liability for the interpretation or use of this report. For Illustration purposes only. Past performance does not guarantee future results. All results are hypothetical, and the results are not based on the performance of an actual portfolio and the interpretation of the results should take into consideration of the limitation inherent in the results of the model. The results exclude any advisory fees, trading cost or other fees or charges. The reinvestment of dividends, interest, capital gains and withholding taxes are all built into the hypothetical analysis. Hypothetical returns may be dependent on the market and economic conditions that existed during the period. Future market or economic conditions can adversely affect the performance of the hypothetical analysis. The index and other amounts shown above do not relate to the Bahl & Gaynor smig® strategy and are for illustrative purposes only.
²Source: Strategas, as of 9/30/2023.
³smig® Small/Mid-Cap Income Growth strategy inception: 3/31/2013.
⁴Source: Bahl & Gaynor, PSN and Factset, 3/31/2013 – 11/30/2023.
Disclosures
As of Date: 11/30/2023, unless otherwise noted.
This Report has been prepared for Financial Professionals whose clients are invested in strategies managed by Bahl & Gaynor. Not for use with the General Public.
Performance is preliminary, subject to change.
The primary focus for this smig® Small/Mid-Cap Income Growth strategy is generating current income higher than that of the Russell 2500 that will grow over time. Protection in falling markets is a secondary goal, with long-term capital appreciation as a tertiary goal. This Strategy focuses on owning small and medium-size companies with a market capitalization between $200 million and the largest company in the Russell 2500 Index at purchase. The Strategy is designed for long-term investors who are willing to accept short-term market price fluctuations. Principal risks of investing in this strategy include stock market risk, management risk, recent market events risk, and small and medium capitalization company risk. Investing in small and medium-capitalization companies involves greater risk and the possibility of greater price volatility than investing in larger-capitalization and more established companies. All equity investments inherently have aspects of risk associated with them; past performance is not indicative of future results. An issuer of a security may be unwilling or unable to pay income on a security. Common stocks do not assure dividend payments and are paid only when declared by an issuer’s board of directors. The amount of any dividend may vary over time. The above is intended only to illustrate how smig® Strategy has behaved in relation to the Russell 2500 Index on down days and makes no representation about investment performance. Indices are unmanaged, hypothetical portfolios of securities that are often used as a benchmark in evaluating the relative performance of a particular investment. An index should only be compared with a mandate that has a similar investment objective. An index is not available for direct investment and does not reflect any of the costs associated with buying and selling individual securities or management fees.
Investment advisory services offered through Bahl & Gaynor (“B&G”), a federally registered investment adviser under the Investment Advisers Act of 1940. Registration does not imply Information or a certain level of skill or training. More information about B&G can be found by visiting www.adviserinfo.sec.gov and searching by the adviser’s name. This is prepared for informational purposes only and may not be applicable to your particular situation or need(s).
Some figures are sourced using third-party data. Bahl & Gaynor does not represent the information is accurate or complete and it should not be relied on as such. Bahl & Gaynor assumes no liability for the interpretation or use of this report. For Illustration purposes only. Past performance does not guarantee future results. The index and other amounts shown above do not relate to the Bahl & Gaynor strategies and are for illustrative purposes only.
The “S&P 500” is a product of S&P Dow Jones Indices LLC (“SPDJI”) and has been licensed for use by Bahl & Gaynor. Standard & Poor’s® and S&P® are registered trademarks of Standard & Poor’s Financial Services LLC (“S&P”); Dow Jones® is a registered trademark of Dow Jones Trademark Holdings LLC (“Dow Jones”); and these trademarks have been licensed for use by SPDJI and sublicensed for certain purposes by Bahl & Gaynor. Income Growth and smig® are not sponsored, endorsed, sold or promoted by SPDJI, Dow Jones, S&P, their respective affiliates and none of such parties make any representation regarding the advisability of investing in such product nor do they have any liability for any errors, omissions, or interruptions of the S&P 500.
Indices are unmanaged, hypothetical portfolios of securities that are often used as a benchmark in evaluating the relative performance of a particular investment. An index should only be compared with a mandate that has a similar investment objective. An index is not available for direct investment and does not reflect any of the costs associated with buying and selling individual securities or management fees